Ground Truth: Inside RAIZ’s Map of Degraded Farmland
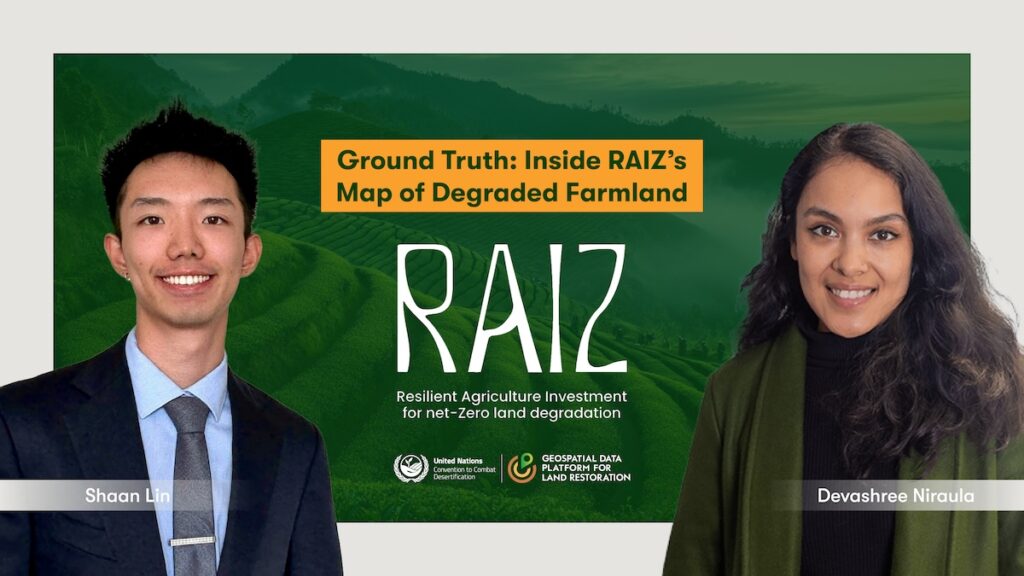
Ground Truth: Inside RAIZ’s Map of Degraded Farmland
A Conversation with Devashree Niraula
Introduction
A billion hectares. That is the land 115 countries altogether have promised to bring back to life — degraded, exhausted, worn-out land. This land restoration is pledged under the United Nations Convention to Combat Desertification (UNCCD). Roughly a quarter of it is farmland: fields and pastures that once fed people and could do so again.
Which raises a question that sounds simple and is not. Where, exactly, do you start?
RAIZ (which stands for “Resilient Agriculture Investment for Net Zero Land Degradation”) is the Portuguese word for “root”, a fitting name for a tool launched at COP30 in Belém, and for what it is trying to do. At its core, RAIZ is a mapping tool built by the G20 Global Land Initiative Coordination Office of the United Nations Convention to Combat Desertification, with support from the Food and Agricultural Organization, the Food and Land Use Coalition, the Alliance of Bioversity International and the International Center for Tropical Agriculture. We spoke with Devashree Niraula, Information Management Expert at the Coordination Office, about what satellites can tell us about degraded farmland, and what they still cannot.
This conversation has been edited and condensed for clarity.
Q: What is RAIZ and how does your work sit with it?
The first pillar, which is where my work sits, is about understanding the extent of land degradation across cropland and pastureland. But knowing where the ground is vulnerable is only half the picture. The tool layers in topography, socioeconomic conditions, and forward-looking climate variability, so you can ask: if there is a shock, or a slow degradation trend, does this community have the mechanism to bounce back?
Climate change is one of the most dynamic things we deal with, and so are degradation and restoration. With climate change, stakeholders already have to be proactive about where you put your money: how communities react to it, how plants react, how agriculture reacts, how pastures react. Taking all of that into account, we’re trying to show what the future would look like in terms of climate variability, and where investment makes more sense.
Q: The “I” in RAIZ stands for investment, which is an unusual word to find in a UN environmental tool. Imagine you are in a lift with a potential investor… You have twenty seconds. Go.
I would avoid all the UN language. With finance people, the pitch is forecast return on investment — where is your investment best placed to make a gain? But investment is not only financial gain. It is also the socioeconomic gain of a particular area.
My pitch would be: invest first in communities whose practice is already strong because the community is the one who takes care of the investment — it is their ownership. This has worked in my own country. Community forests in Nepal succeed because the community makes sure the forest is not exploited for its resources. And remember that agriculture and pastureland are sensitive spaces. This is not just profit-making. It is about whether there is enough food and enough seed for the future.
Q: Let me push on the logic. The dashboards that you built map vulnerability and adaptive capacity. Follow that through and you get something counterintuitive: if a place is less vulnerable and better able to adapt, restoration investment there is more likely to pay off. Doesn’t a map built to attract money quietly point that money away from the most damaged land?
Remember the scope: cropland and pastureland. And here the distinction between land “cover” and land “use” matters — how you intend to use the land. Take mining, for example. Land subjected to mining is highly degraded. But it is not land you would use to plant crops. The same goes for a heavily built-up peri-urban area where soil permeability is too low for anything to grow, or a region struck by a major landslide. Those areas absolutely need to be restored — one hundred percent. But the intervention they need is not the food-security intervention this tool is designed for.
There is also a time dimension investors must understand: taking land from degradation to restoration can take several years before there is a good return.
And some land simply cannot carry a crop, so we calibrate it for that. I come from Nepal, a mountainous country where terrain doesn’t stop us because we have terraced farming, as is the case in China and Vietnam. We build terraces where the sun hits, never in the shadows. The vulnerability mapping shows you exactly that: where the shadows fall, where the slope is too steep, where the ground is permafrost, where the water table and soil nutrients cannot support a crop. If the construct of the area simply doesn’t make sense for cropland or pasture, the map tells you.
Q: [On RAIZ Mapping Tool] When we opened the national dashboard together, the first thing I saw was a risk trajectory running out to 2040. What should a policymaker see first?
For me, the most important chart is the one showing a country’s restoration commitments side by side. For example, Mongolia has committed to restore 1.8 million hectares of land under the land degradation neutrality framework of the United Nations Convention to Combat Desertification — the single largest figure — alongside its 1.4 million hectares restoration commitment under the Climate Change Convention and 600,000 hectares under the Bonn Challenge. That is a huge amount of land, in a country where grassland and rangeland are the most significant land covers.
What the tool then says to a policymaker is: you have already made this commitment, so why not start where restoration would be most impactful for the community and the ecosystem, and most feasible? Start with a place that can be your testing ground before you expand to the whole region.
Because restoration is not a thing where you plant trees and leave. You really need to maintain it. And this is where bringing in the private sector helps even policymakers. The private sector gives jobs to communities, and those communities, in turn, become the safeguarding entity of the restoration project. Make it owned by people, so it is a sense of pride for them as well.
Q: The methodology page does something I found unusual for this kind of platform. Specifically, it lists its own limitations. How much should we trust what satellites tell us?
You have to handle the data with care because it is your responsibility to present the Earth as it really is. Global land cover products are very good now — resolution can be as fine as ten metres — but calibrating them to a global scale introduces errors. Take Saudi Arabia. The global land cover class for much of that region says bare soil. But Saudi Arabia is not just desert. When I was there, I saw wadis that collect moisture and are lush green. The satellite-derived class simply misses that.
Some indicators you cannot go wrong with. Nightlight activity — the lights around cities — needs little calibration and is a very good proxy for economic activity. You know Cologne has more activity than Bonn without asking anyone. But others need ground-truthing. The index that measures the greening of an area, known as Normalized Difference Vegetation Index, can be noisy from year to year or even season to season. If you see greening over two or three years, is that a restoration effort or the result of just heavy rainfall? Only country reporting can tell you. So satellite imagery and country reporting act as a check and balance on each other. They go hand in hand.
Q: The map was launched only recently. Have policymakers or ministers been surprised by the map for their own country?
We have had conversations at the level of national focal points, ministry scientists and directors-general, but it hasn’t reached ministers yet, though they are aware. With some countries, we presented the map and methodology just days ago. They have their own methodology, and what excites me is that the tool provides a sandbox where they can put in their own data and methods and test them with us. Other scientists gave us very good reviews, partly because we are not starting from scratch. The approach checks boxes that bodies like the Intergovernmental Panel on Climate Change have already validated. After COP 17, deeper engagement with countries is the next step.
Q: The Director for G20 Global Land Initiative, Mr. Muralee Thummarukudy, said in an interview after the AI for Good Summit, that the question has shifted — not just what AI can do “for” land, but what it is doing “to” land. Does it concern you as a geospatial data scientist?
I share Muralee’s concern. Demand for artificial intelligence will keep growing — I don’t think this is a wave that fizzles out — and that means more data centres, putting pressure not just on land but on water, and these resources are interlinked. That conversation is only just starting. And this is where the UN’s strength comes in: access to countries, to think tanks, to agencies. It is our opportunity to bring those stakeholders together and set a baseline — if a server facility is built, this is how much natural resource it may draw; this is what the water quality must be after use. An environmental impact assessment, and in the end, a check and balance. It is a role an institution like ours should take a lead in.
For more events during COP17, please find the full schedule here.